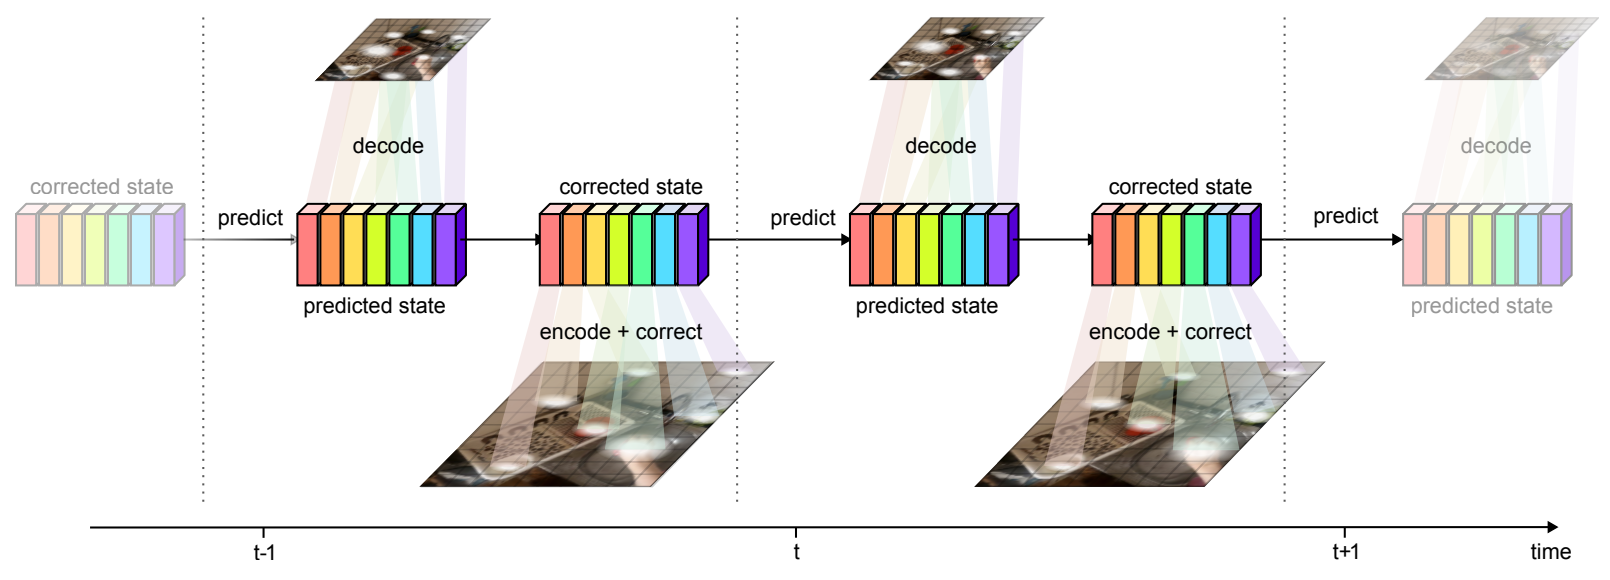
Visualizing Token Attention Maps
For each pixel location, at each frame, we colour code the token that has the most attention weight at that location. If the representation is stable - i.e. if the same token tracks the same content as it moves - we should see the motion of the token argmax move with the scene motion, which is the case.


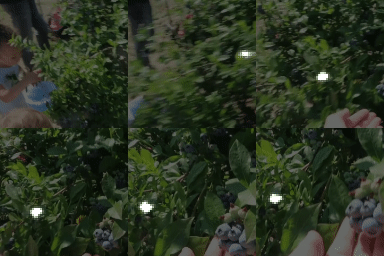

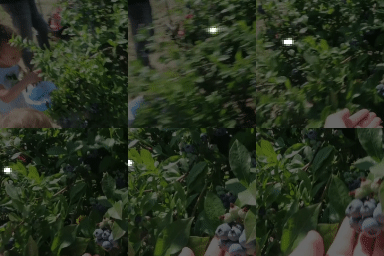


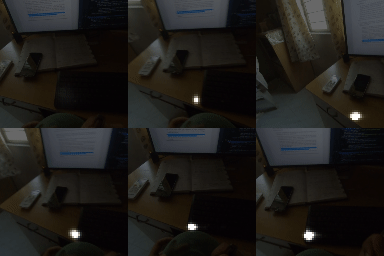
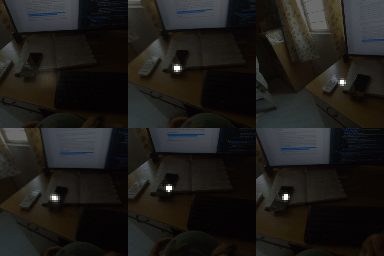
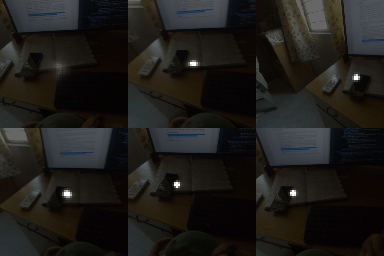



Top Row from left to right: colour coded arg-max tokens, blended arg-max with video, ground truth video, frame predictions. Bottom row: 4 randomly selected tokens latch to specific scene elements and track them as they move
PCA Analysis of Tokens
We unroll the model over a batch of 24 short clips, each 12 frames in length. We take the predicted states of all clips across all time steps to obtain a 294912 x 512 matrix where 512 is the token size. We calculate the PCA components of this matrix and take 3 (out of 512) of the leading components and visualize them as RGB. Note the consistent cross sequence structure, relating to meaningful elements in the scene. From left to right, PCA in RGB, blended with original video, original video.


Changing the Number of Tokens
Since the model has a latent set of tokens there are no parameters in the model that depends on the number of tokens. As a result we can instantiate the model with a varying number of tokens without retraining. As can be seen the model adapts elegantly, making the tokens bind to larger areas of the image but still being able to predict future frames adequatly and track scene structure. This model has been trained with 1024 tokens. Shown, from top to bottom, are 256, 512 and 1024 tokens, from right to left predictions, ground truth frames, blended argmax attention, argmax attention.


